A Random Walk Down Diamond District

I started watching NBA around the 2012–2013 season. I was never a dedicated fan, more of an occasional viewer. Sometimes I would drift away for a season or two, only to be pulled back in by an exceptional performance or a miracle on the court. To me, it was always just a game – something to have as a background while I was busy with other things, occasionally glancing over when a replay or highlight caught my attention. Betting on games never appealed to me also. I assumed that gaining any meaningful advantage would require far more time spent studying rosters, statistics and rules than I was willing to invest.
In 2019, I was looking to see Uncut Gems by Josh and Benny Safdie. Their previous film, Good Time, had been one of the most exciting movies of the 2010s, so a new basketball-themed thriller with Kevin Garnett immediately sounded intriguing. I wasn’t disappointed. KG’s fictionalized version of himself was as menacing as his presence in the games. Adam Sandler as Howard Ratner, a New York Diamond District jeweler, compulsive basketball gambler and charismatic asshole, delivered a great performance with a unusual flavor of cringe that was fascinating to watch.
As Good Time had done a few years earlier, Uncut Gems left me with thoughts and ideas bouncing around in my head. One of them was that sports betting might be worth exploring.
Initial Hypothesis

I was interested whether it is possible to think about sports betting in terms of investing strategies. I was already familiar with the principles of traditional finance, and betting seemed like something that could be approached as a form of trading. To structure my thinking, I decided to try to apply some well-known investing models and tactics.
Random Walk
There is a well-known book, A Random Walk Down Wall Street by the American economist Burton G. Malkiel. It explores economic bubbles and examines how investors can build reliable strategies while avoiding the "madness of crowds". Over the past fifty years, the book has gone through numerous editions (my copy is the twelfth), each one updated to reflect major economic events that occurred in the meantime. Updates mostly are just new illustration of his main themes. The internet boom? Another case of crowd-driven speculation resulting in a bubble. The mortgage crisis? Yet another bubble. Bitcoin? Treated with strong skepticism, possible a bubble. It makes me hope that despite Malkiel's respectable age the world would see another edition with his hot take on current AI hype.
The central thesis of the book can be summarized as follows: stock prices follow a "random walk", meaning they are essentially unpredictable in the short term. As a result, most investors cannot consistently outperform the market. Malkiel ultimately concludes that the most reliable strategy is long-term, low-risk investing, and he presents a compelling case in support of this view. I tend to agree with this thesis. Today, millions of individual investors are familiar with this idea in one form or another, and many have experienced its implications firsthand. But out of curiosity, I also want to explore the other side of the coin. What do short-term strategies have to offer?
Malkiel distinguishes between two primary approaches to market analysis:
- Technical analysis attempts to forecast future price movements by analyzing past market data – primarily price and trading volume. It relies on charts, trends, support and resistance levels, and recurring patterns. The underlying assumption is that market behavior follows recognizable patterns and that investor psychology tends to repeat over time. Malkiel argues that, in highly efficient markets, such patterns are unreliable and do not provide a consistent advantage, especially after accounting for transaction costs.
- Fundamental analysis evaluates a security by examining the economic and financial factors that determine its intrinsic value, such as earnings, growth prospects, assets, management quality, and broader macroeconomic conditions. The goal is to identify mispriced assets and profit when the market corrects them. While Malkiel acknowledges that this approach is logically sound and can sometimes be effective, he argues that in efficient markets, most relevant information is already reflected in prices, making it difficult to consistently achieve superior returns.
Most of Malkiel’s analysis is grounded in traditional financial markets – the world of stocks, bonds, U.S. Treasuries and macroeconomics.. What interests me is the extent to which these ideas apply to sports betting.
Diamond District
Malkiel only briefly touches on sports, noting that bookmaker-driven markets inherently have a negative expected return for bettors, since odds are manually set to ensure a margin in favor of the bookmaker. He also discusses the concept of the "hot hand" on basketball example – belief that a player who have successfully scored a shot is more likely to score another, which is an illusion. Last statement is absolutely true in my opinion. While I have experienced the "hot hand" phenomenona as a viewer of my favorite teams or players, in my mind it is more of an emotional perception than rational analysis. The first point about bookmaker's margins also appears logically sound. If a centralized entity controls the market, it is reasonable to assume that it will structure it in a way that guarantees profit. But what happens if we remove the bookmaker’s margin from the equation? This is where Polymarket comes into play. It is a prediction market platform that includes sports betting, and one of its defining features is the absence of a traditional platform fee.
Polymarket's NBA section offers multiple markets for each game (moneyline, totals, individual player statistics) and provides sufficient liquidity. It also exposes an API, allowing access to historical data for NBA games over the past few years, including the distribution of winning probabilities both before and during games. On Polymarket, odds and prices are the same thing: they represent the value of a token tied to the occurrence of a specific event, ranging from 0 to 1. This makes the platform particularly suitable for technical analysis. One can search for patterns in historical market behavior, analyze how prices evolve over time, and potentially correlate movements with external factors such as timing or whale movements. This approach relies on structured data, mathematical reasoning, and statistical modeling rather than subjective judgment.
In contrast, a fundamental approach focuses on understanding the game itself – team strengths and weaknesses, player performance, coaching decisions and other contextual factors. It inherently depends on domain expertise. While it may be possible to partially automate such analysis using structured data (e.g., player statistics or team metrics), building a meaningful system still requires substantial domain knowledge. Given my limited expertise in this area, I chose not to pursue this path.
In a sense, collective fundamental analysis is already embedded in pre-game odds. These odds reflect the aggregated expectations of market participants before the game begins, forming something close to an efficient market equilibrium. Typically, pre-game odds exhibit minimal volatility. Sudden changes are driven by external events such as injuries or breaking news, not statistical shifts. During the game, however, the influence of fundamental factors diminishes significantly. For example, if a team is trailing by ten points with one minute remaining, long-term metrics like three-point shooting percentage or average rebounds become far less relevant than the immediate game situation. At this stage, technical analysis becomes more interesting.
Thinking about both models, I came to the conclusion that fundamental analysis mostly related to a question: will an event occur given a set of conditions at the specific moment, e.g. "will team A have more points than Team B at the final buzzer"? Technical analysis, on the other hand, focuses on the process rather than the result. It examines how market participants continuously update their expectations over time. The key question becomes: how does the market players evaluate the probability of this outcome at each moment, e.g. "how market's feeling about Team A's hot hand will change in next 5 minutes"?
The ability to choose a time horizon is particularly important. Price movements over short intervals are highly volatile and often resemble a random walk, but more stable patterns may emerge over longer segments. For example, a clear favorite may play more conservatively in the first half, conserving energy for fourth quarter. This can influence market participants: if the expected dominance is not immediately visible, the favorite’s odds may decline, while the underdog becomes more attractive as its perceived chances increase – even if the underlying fundamentals of the matchup have not actually changed. In this sense, short-term price movements can reflect not only objective game dynamics, but also collective perception and overreaction to limited information. Selecting an appropriate time frame helps filter out this noise and makes it easier to identify more meaningful patterns in price behavior.
In sports markets, volatility is further amplified by the nature of the games themselves. Leagues have an interest in maintaining viewer engagement, which gives them an incentive to influence gameplay to be dynamic and unpredictable. In the NBA, sudden injuries and rapid scoring are relatively common, contributing to frequent and sometimes sharp price movements. Given this high in-game volatility, combined with Polymarket’s ability to trade positions dynamically (i.e., buy and sell tokens during the game), technical analysis becomes particularly appealing. It does not require deep domain expertise and aligns well with the available data.
For these reasons, I formed the hypothesis that it may be possible to gain a competitive edge by relying only on technical analysis of past Polymarket NBA markets without any fundamental domain knowledge. All is left to do is test it.
System Overview

The goal of this project was to build a system for technical analysis of historical Polymarket NBA events. I formulated the following base system constraints:
- Architecture: decompose the system into microservices to ensure flexibility and allow individual components to be replaced if needed.
- Hardware: run the project locally on a Raspberry Pi 3B+ instead of in the cloud to minimize the risk of private key exposure.
- Software: not much, just follow KISS and DRY, and try not to murder the Raspberry PI in process.
System was decomposed to the following services:
- (Core) Oracle: fetches data from Polymarket, loads it into a local database and serves as single source of truth.
- (Core) Report: generates analytical reports based on Oracle datasets, in both visual and textual formats.
- (Optional) Strategy: defines and formalizes trading strategies derived from Report-based hypotheses.
- (Optional) Trader: executes autonomous limit orders mangement if a Strategy is validated.
- (Optional) Telegram Bot: provides a user interface for interacting with the system.
For data storage, I chose a relational database over NoSQL, as it is a natural fit for financial data and hierarchical entity structures. The stack consists of PostgreSQL with asyncpg and Alembic for migrations. I kept open the possibility of switching to MySQL if hardware limitations of the Raspberry Pi became an issue. Scheduled database updates and backups are handled via Celery Beat tasks.
Communication between services needed to be asynchronous from the start to improve performance, particularly for database I/O operations. RabbitMQ was selected as the primary messaging system due to its advanced routing capabilities, which may become important with the introduction of the Trader service. In particular, RabbitMQ’s support for message persistence makes it suitable for reliably managing limit orders. When necessary, services can also communicate via FastAPI async endpoints.
Latency requirements are relatively low, as the project primarily focuses on analyzing completed markets. Even if the Trader service is implemented, high-frequency trading is not a goal – orders would operate on a timescale of minutes rather than seconds. Therefore, typical limitations of Python, Raspberry Pi hardware, and a standard home internet connection are not critical.
The Strategy and Trader services, if developed, would not be open source.
The base of this project is rooted in quantitative (technical) based analysis. The primary focus is on transforming raw market data into meaningful visual representations. In contrast, qualitative (fundamental) analysis requires significantly more time and effort, often resembling an interpretive discipline and relying on diverse external information sources. While such data can be quantified, and the system could be extended to support it (for example nba_api Python library), I intentionally excluded it from the initial basic implementation.
The reason is that additional data can introduce noise. Expanding the dataset does not necessarily improve analytical quality, in some cases it can degrade it. Low-value data not only fails to generate meaningful insight but can also distort conclusions and inject unwanted noise. For this reason, I limited the system to data provided by Polymarket – token price time series and final game outcomes. Any additional information if needed should be derived directly from this data rather than external sources.
However, project may evolve with time, so I made database structure and interfaces as open and abstract as possible if future source upgrade will be needed.
History Oracle
Polymarket evolves rapidly, frequently introducing new features and reworking existing ones. The sports section underwent a major refactor in late 2024 / early 2025, adding, among other things, a live game view and restructuring "games" into "events" with multiple nested "markets" like traditional moneyline, spreads and totals. These changes resulted in different API endpoints and response formats for data before and after the 2025/2026 NBA season (and likely for other leagues as well).
For example, the old API returned a single large array containing all NBA games, while the new version requires separate requests for each individual event, providing more detailed information such as the current game period. Additionally, legacy data required &slug=nba query parameter, while current version rested on different series/10345 endpoint. Because of this both client and parser had to be extended with conditional logic. However, since legacy data is only processed once during initial database setup, this trade-off was acceptable.
Different types of data require different API bases. Polymarket uses the Gamma API for market data and the Central Limit Order Book (CLOB) API for trading. Although trading functionality is outside the scope of the Oracle service, token price history can only be retrieved via the CLOB API. As a result, the core data client required two separate adapters, each built on a different base URL and defined as class-level attributes.
class NBAGamesClient(PolymarketOracleGammaAPIClient):
    _subdirname = "games"
    _file_prefix = "series"
    _file_rewrite = True
    _rate_limit = 349  # https://docs.polymarket.com/quickstart/introduction/rate-limits#gamma-api-rate-limits

    def __init__(self, session: aiohttp.ClientSession, by_slug: bool = False) -> None:
        if by_slug:  # legacy pre-2025/26 seasons
            super().__init__(session=session, params=[{"slug": "nba"}])
        else:        # seasons 2025/26 and later
            super().__init__(session=session, endpoints=["10345"])
        self._base = urljoin(self._base, "series/")


class NBAPricesClient(PolymarketOracleClobAPIClient):
    _subdirname = "prices"
    _file_prefix = "token"
    _file_rewrite = False
    _rate_limit = 999  # https://docs.polymarket.com/quickstart/introduction/rate-limits#clob-markets-&-pricing

    def __init__(self, session: aiohttp.ClientSession, params: list[dict[str, Any]] | None = None) -> None:
        if params is None:
            params = [{}]
        super().__init__(session=session, params=params)
        self._base = urljoin(self._base, "prices-history/")
Despite the updated API, important data such as team names and scores not present as separate JSON fields, so it still needs to be scraped and parsed additionaly from other fields. Polymarket's policy may change in the future, but my current understanding the only data they guarantee to be true are their core entities – token IDs and their prices. All other information should be treated as unreliable metadata and it is implied that it should be looked elsewhere. I used Pydantic model validators to normalize teams, scores, and game statuses.
Fetching price time series requires separate API calls for each team. Each team is represented by it's own token, and while theoretically their sum should always add up to 1, I decided to fetch data for both. Because token timestamps is rarely are the same for both teams, this gives a more detailed price picture. To extract maximum useful value from the data I distinguished teams as "guest" and "host" following the informal convention that the away team appears first in matchup titles.
The resulting data is stored in three PostgreSQL tables: events, markets, and prices. To keep system open to possible upgrade with other data sources, I kept a game_id field, assuming it matched the official NBA identifier. Typically, this is a unique 10-digit code where the first 3 digits indicate the competition type (001 for preseason, 002 for regular season, 003 for All-Star, 004 for postseason), followed by 2-digit season start year and 5-digit game number (00001-01230 for 30-team regular season). However, after populating the database, I noticed that Polymarket uses an 8-digit ID instead. Initially, I assumed leading zeros were removed, but all IDs start with “2,” and the structure does not match the NBA format. It also does not correspond to any internal event ID, so the purpose of this field is still is a mystery to me.
Game Reports
Since my goal was to rely exclusively on Polymarket data, I decided to base all reports on price movements over time. While "win probability" suggests a more fundamental analysis tied to some domain knowledge – be that the final score of a quarter, rebounds and assists count of first half, or final score at the buzzer – I chose to treat odds only as token price time series. This emphasizes the dynamic nature of the market and the ability to trade independently of the game outcome – buying and selling a token without binding to a game stats. In other words, the question becomes not whether the Boston Celtics will beat the Miami Heat, but whether there will be a moment when a team's token price increases by, say, 50%.
To make visual more exciting and pleasing to look at I assigned colors roughly corresponding to each team home and away official color scheme. At first I tried to use concrete HEX values, but I quickly realized that using fancy tones like "Knicks Orange" and "Oklahoma City Thunder Sunset" is resulting in incomprehensible mess, since similar shades don't provide enough contrast to be distinguishable. Instead I constructed a set of dark colors for guests and light for hosts with rough correspondence to team's major color scheme, which at the end happened to be the best solution.
Data visualisation for both reports was made with matplotlib library as de-facto standard Python solution for creating charts from datasets. Because this library supports adding background images only inside plot area and not behind whole image (or at least I can't force it to do so), additionally I used pillow to create a nice background. I used this combination in my past projects, and I was happy with the result. Image manipulation is CPU-bound task, so adding async would introduce unnecessarily complexity without any performance gain.
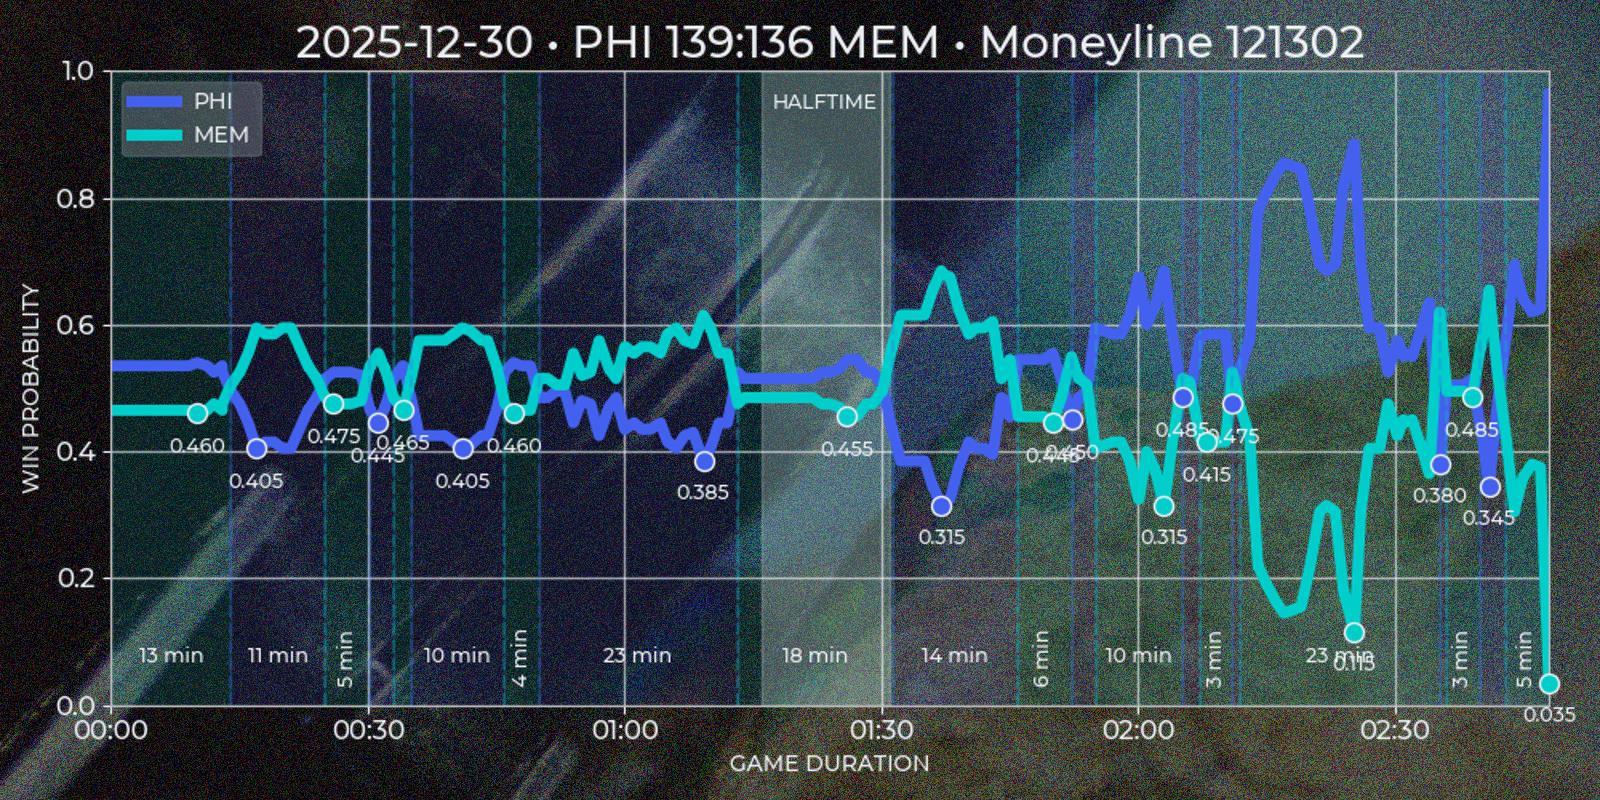
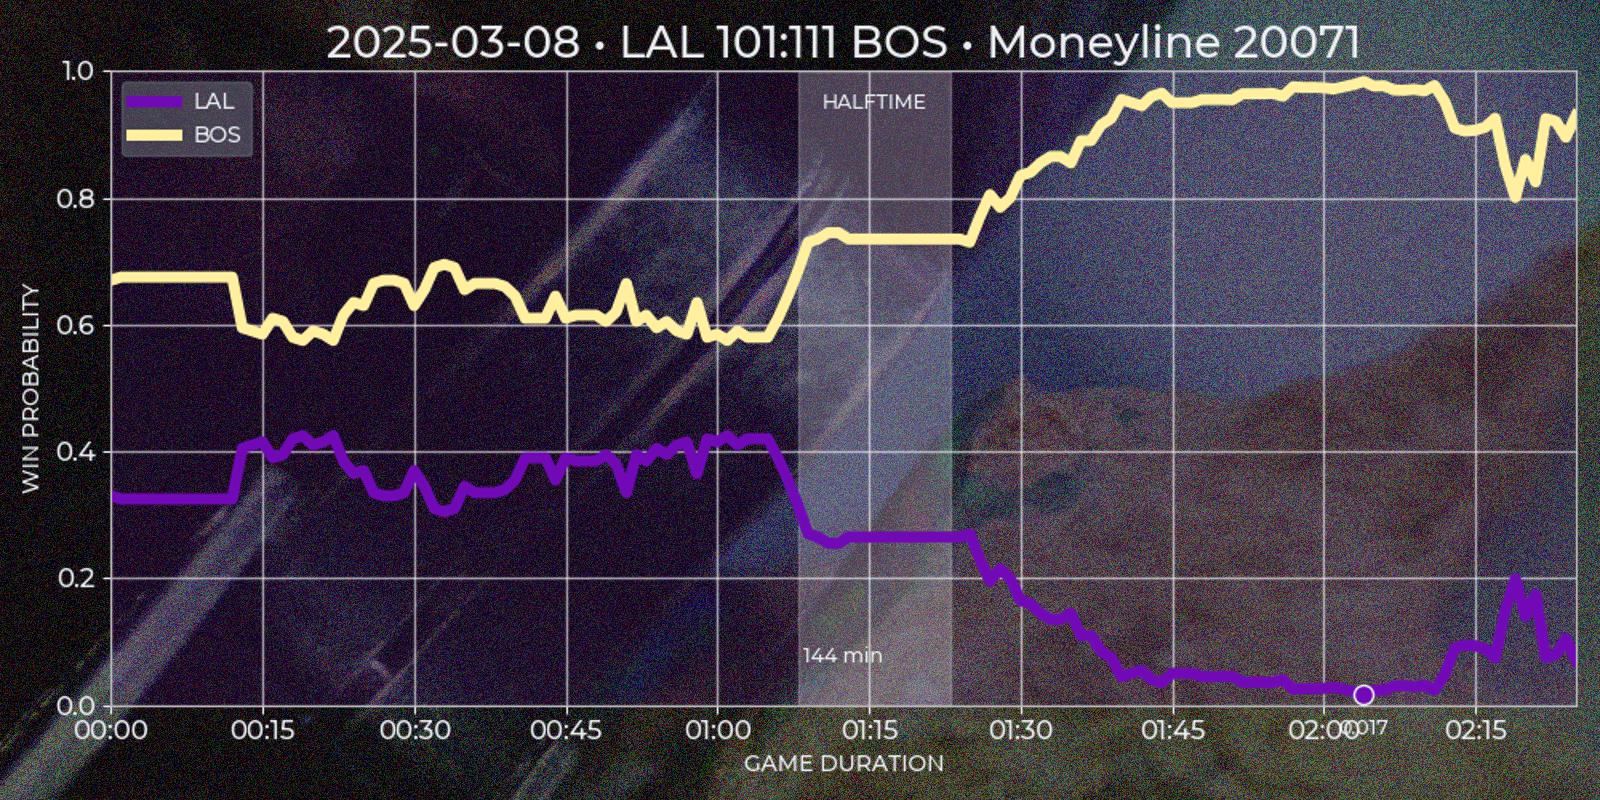
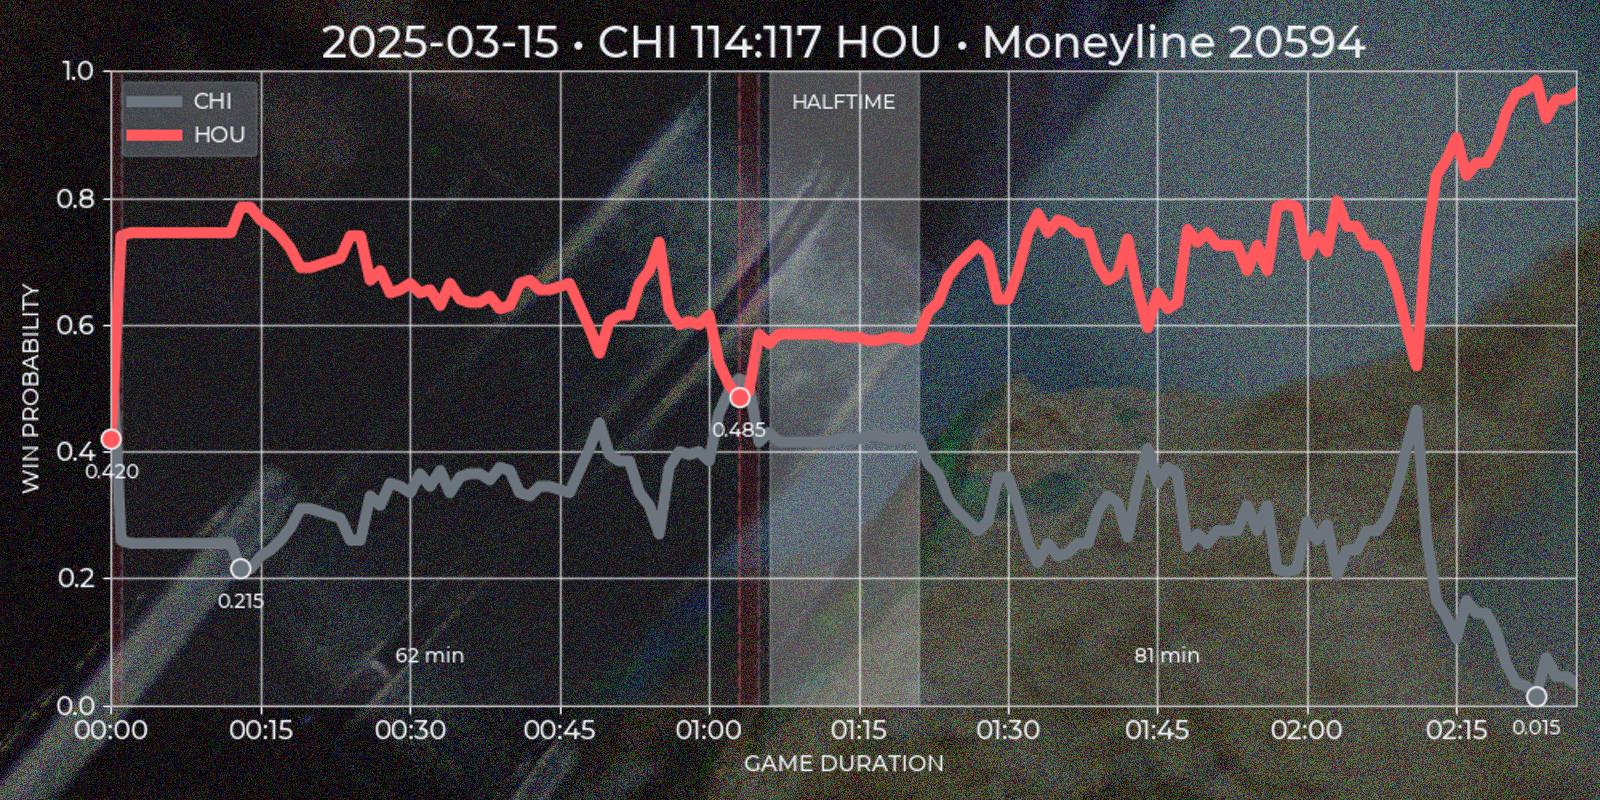
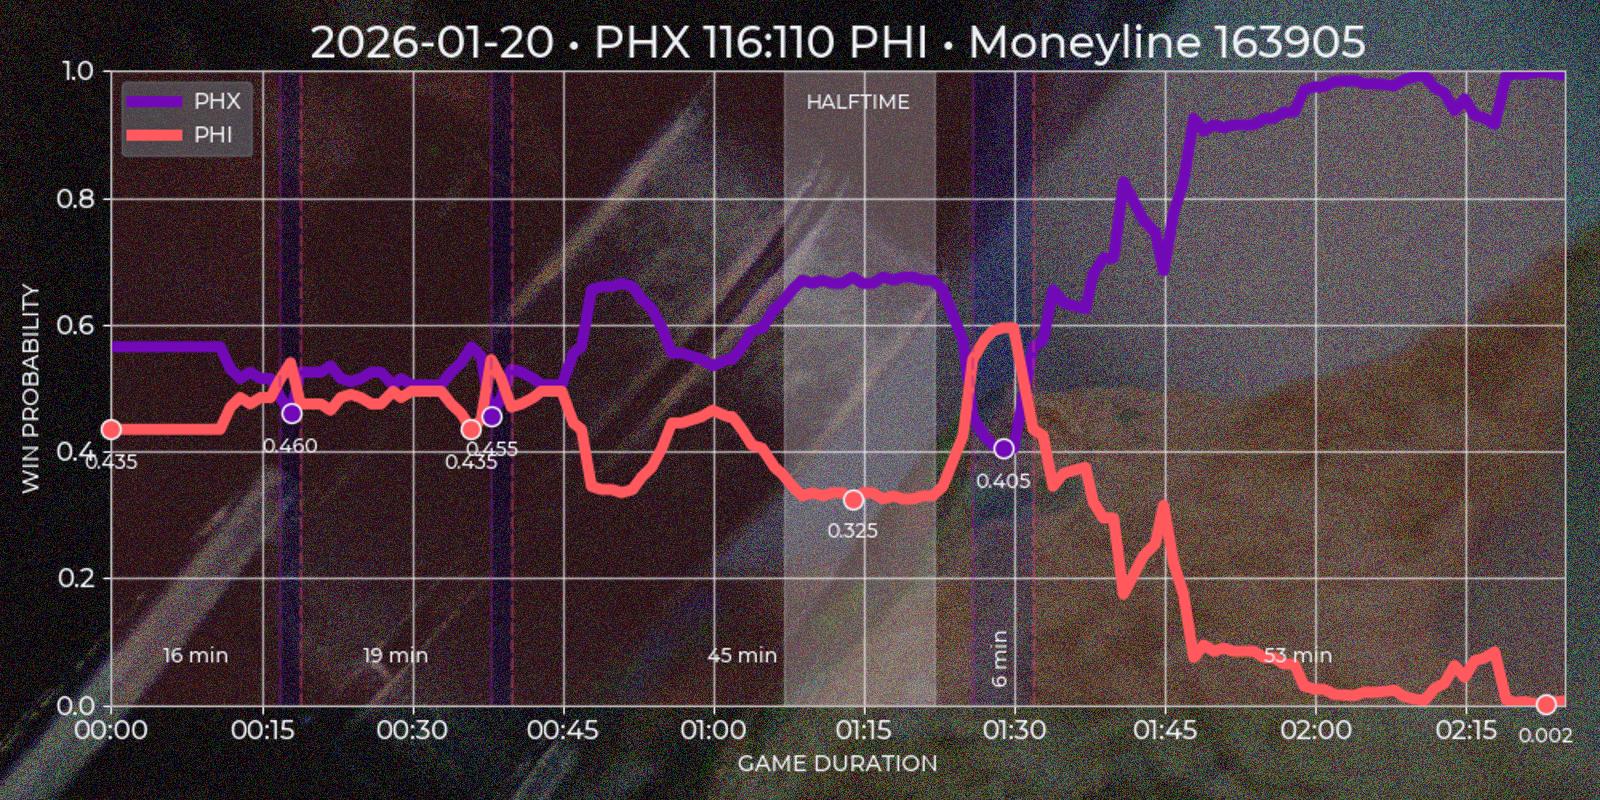
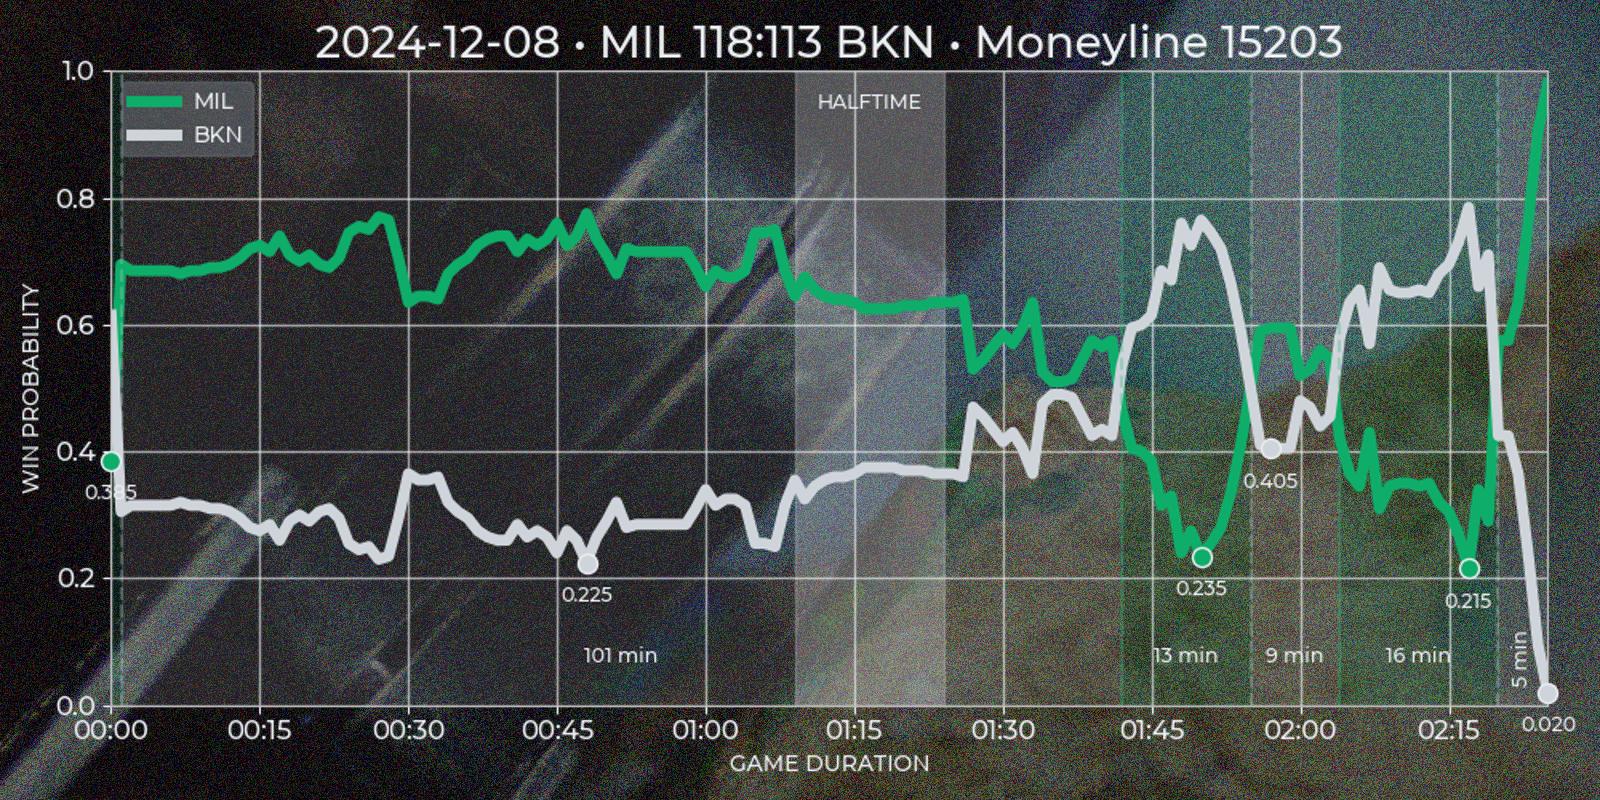
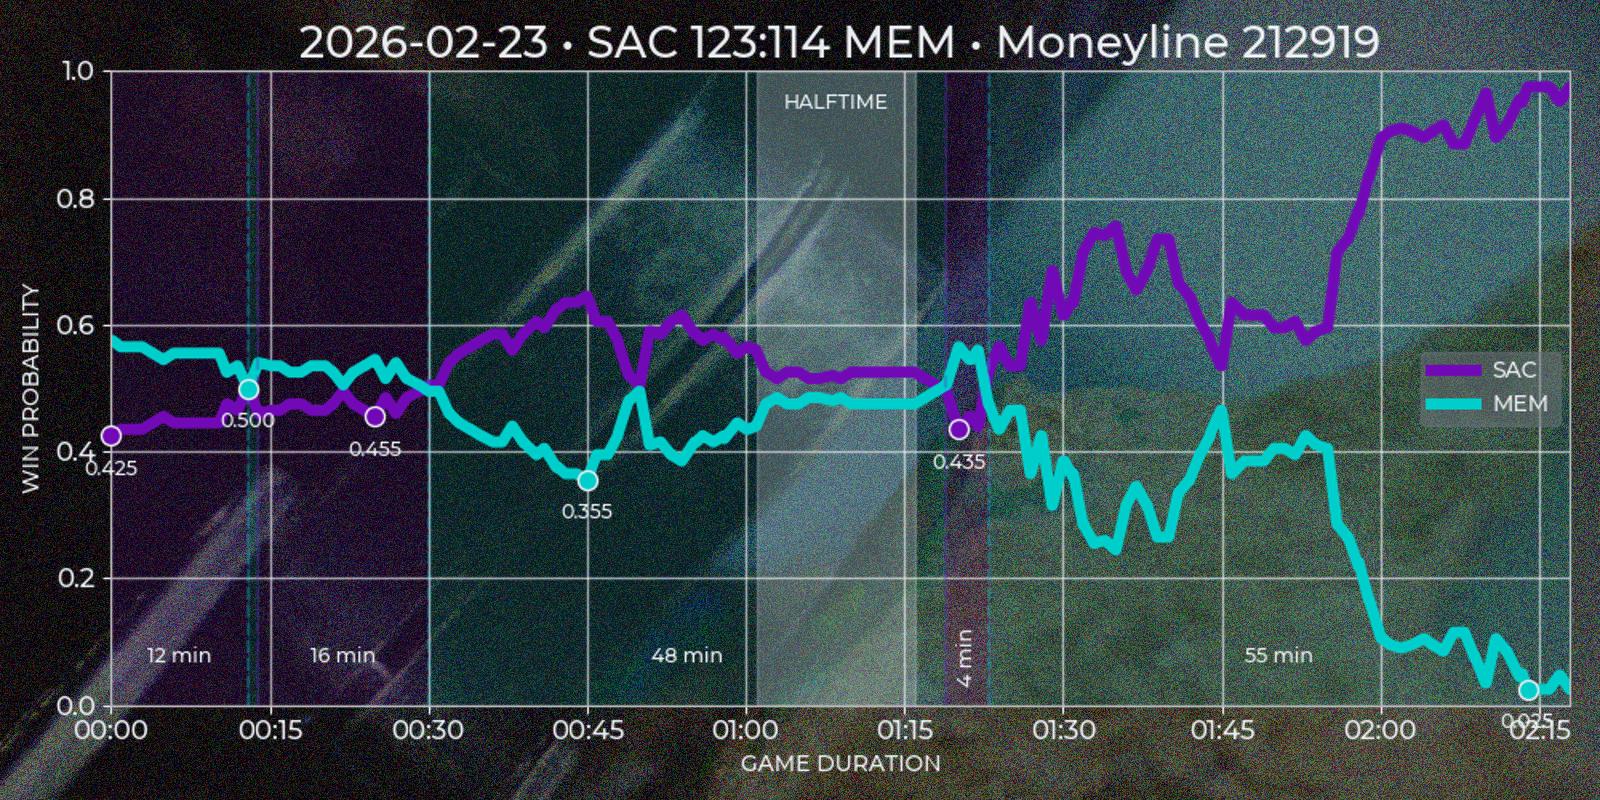
Quote Series
Polymarket operates around "markets", which are open well before a "game" starts and close long after it ends, often spanning about a week before and a day after the match. Since price movement is minimal outside the actual game, these periods are not useful for technical analysis. Additionally, Polymarket’s UI does not distinguish in-game time for past markets, which is a limitation for this type of strategy. To address this, I created a custom "Quote Series" report, extending Polymarket’s default chart for a single game. It plots both teams token prices over match duration, highlighting underdog segments on time axis and local price minima on token axis.
To extract meaningful insights from price data, I developed several heuristic rules. The first challenge was reliably determining the end of a game. While the API provides a gameStartTime field (Polymarket cancels all open orders at the game start, so it absolutely has to have this data), the finishedTimestamp field is missing in legacy sports API and sometimes incorrect in current version (for example in my experience it is often reflects market's resolution time rather than game's final buzzer). I defined the game end as the first timestamp that satisfies the following condition: if after 1 hour and 40 minutes from game start there was a 30 minute window where one of the tokens price would be less than 0.01 or more than 0.99, then first timestamp of such period would be considered as a game end.
_min_game_time = 100 * 60  # assumed minimum duration for NBA game
_min_waste_time = 30 * 60  # time window with no price changes
_lost_price = 0.01         # token price at which team is asumed to have lost
_won_price = 0.99          # token price at which team is asumed to have won
The _min_game_time reflects the modern average NBA game length, with additional ~30 minutes buffer for edge cases if game duration was lower then expected. The _min_waste_time covers opposite edge case, where halftime may be called unusually late. Token value never reach full 0.0 or 1.0, and at extreme values they may fluctuate due to market behavior, forcing a sum of both tokens not to add up to 1.0. I suspect it happens either because of massive volume of selling open orders of a lost team's token, or it is API's inconsistency. Either way, forcing only one of price conditions to be enough to settle the game end made sense. This logic is applied during the ETL phase to avoid recalculating it for every report and to keep database size to a minimum.
The next step was segmenting the time series into underdog intervals – periods when team token is quoted less then 0.5. I wanted to see which team was losing, for how long, and what was the local price minimum. Since Polymarket provides separate price series for each token with timestamp step of about ~1 minute, and timestamps may not align perfectly, I normalized the data using the relationship token_a_price = Decimal(1.0) - Decimal(token_b_price). This ensured consistency and potentially improved precision to 2x times in best cases. First underdog segments are defined by price comparisons relative to the 0.5 threshold, flipping to other team if exceeding this mark. In the rare case of equal prices, the guest team is treated as the underdog. After the flip (end_ts - start_ts) * 60 gives a duration in minutes, and min(prices) gives a price minimum of a segment.
Finally I would like to indicate a match halftime. Polymarket response for markets has a period field which is not useful after game end, so I had to calculate halftime based on price time series. My base conjecture was that halftime should be a window for at least 15 minutes close to the center of a game, where price volatility should be low relatively to previous and next windows. I calculated the standard deviation for 15 minute windows with 1 minute step for guest and host prices and gave each window a score = standiv_guest + standiv_host + distance_from_center with minimum score being the best candidate. Unfortunately timestamp steps given by API are to wide to indicate four regular quarters this way.
Polymarket also shares score field in it's market response. I would love to add team points on time series chart, but without calling API during live game it is impossible to scrape them. So getting score data forces invoking secondary sources, which is not in my current scope. However this field is still useful, because it could be used as additional condition for marking the winner.
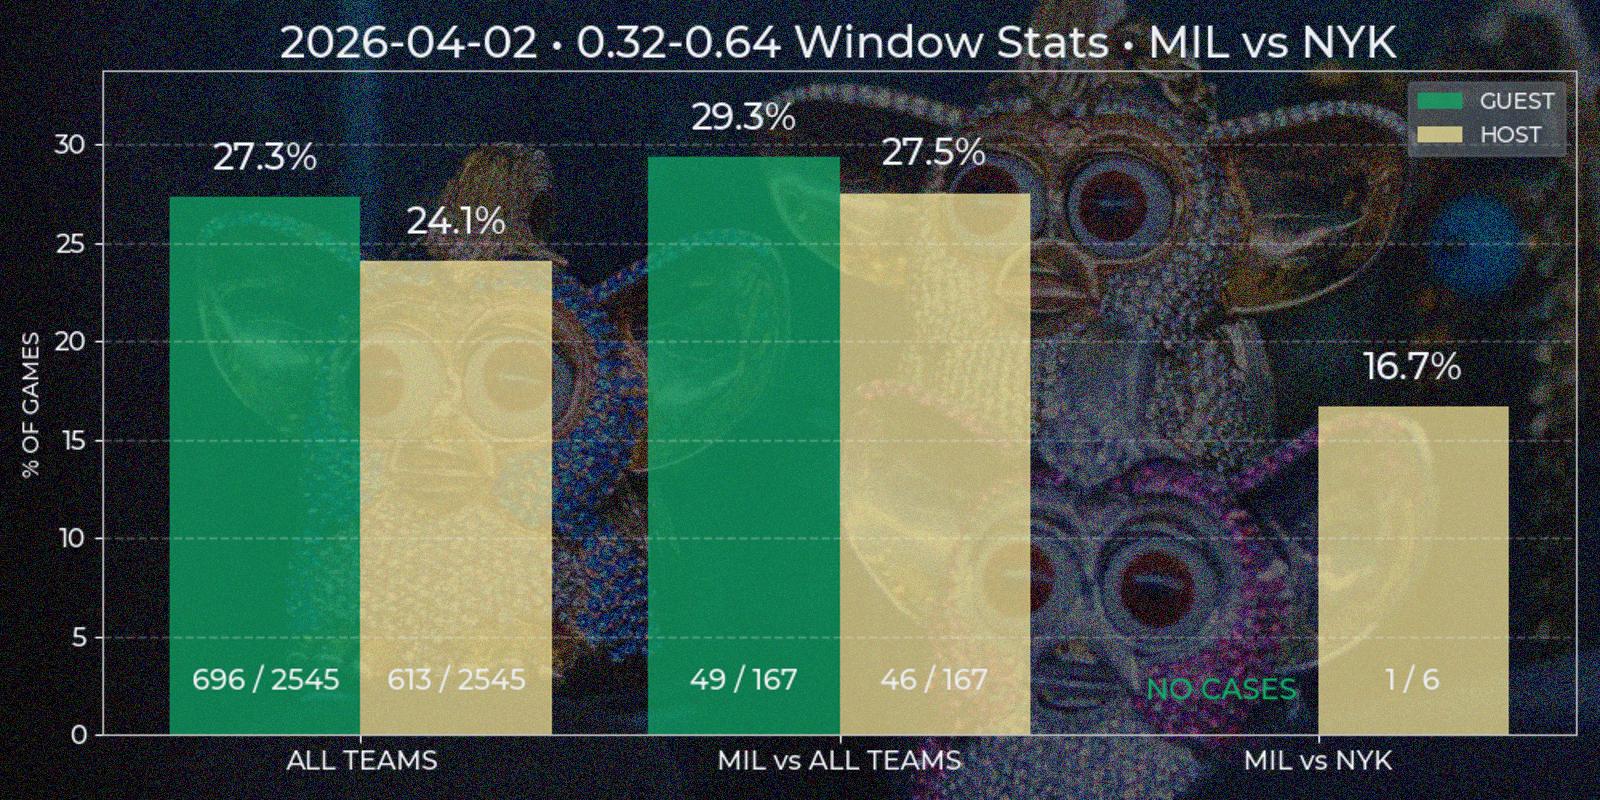
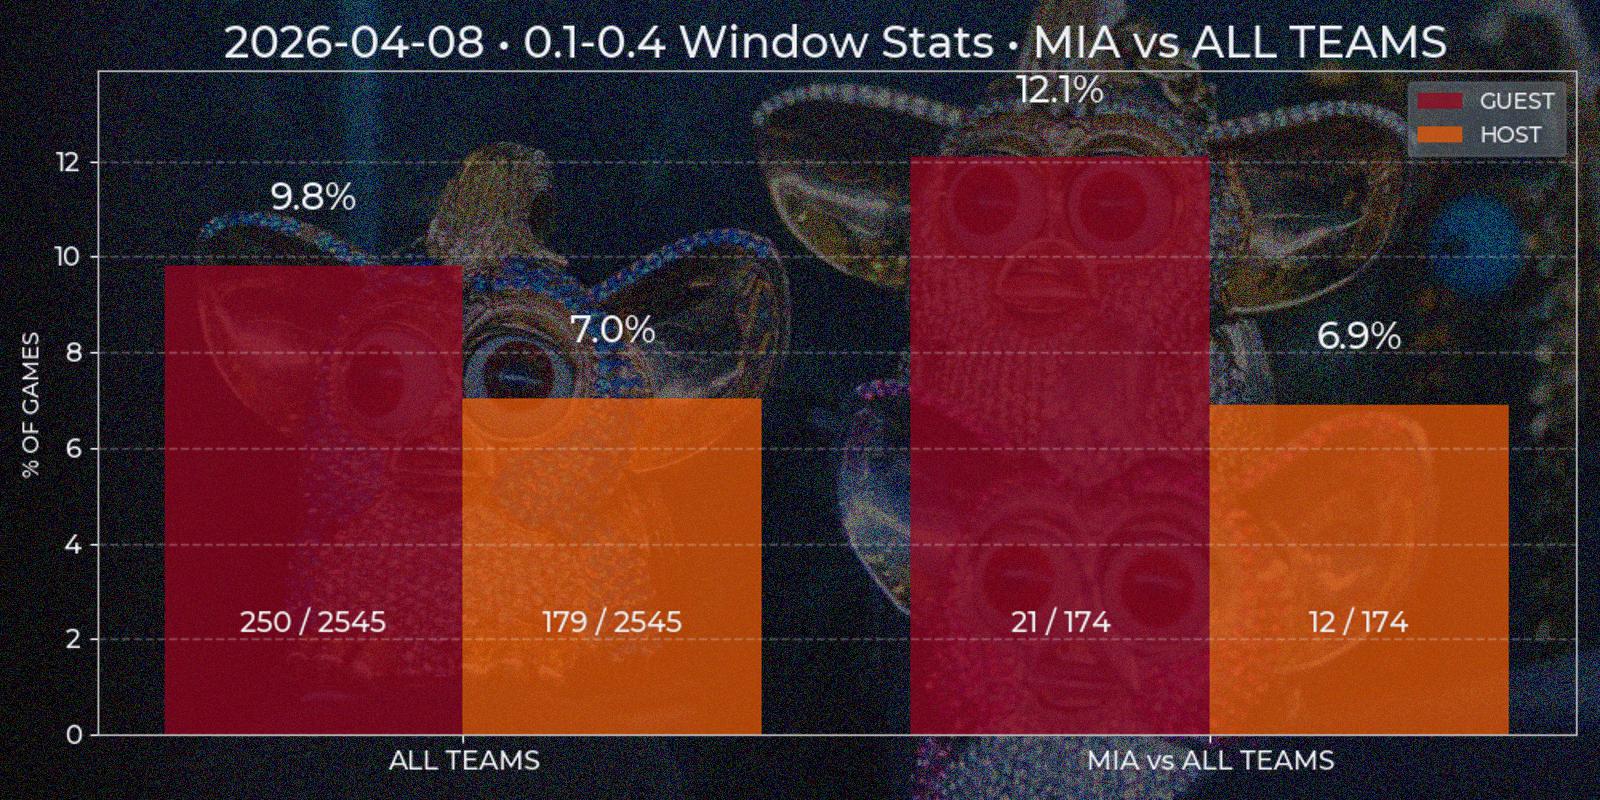
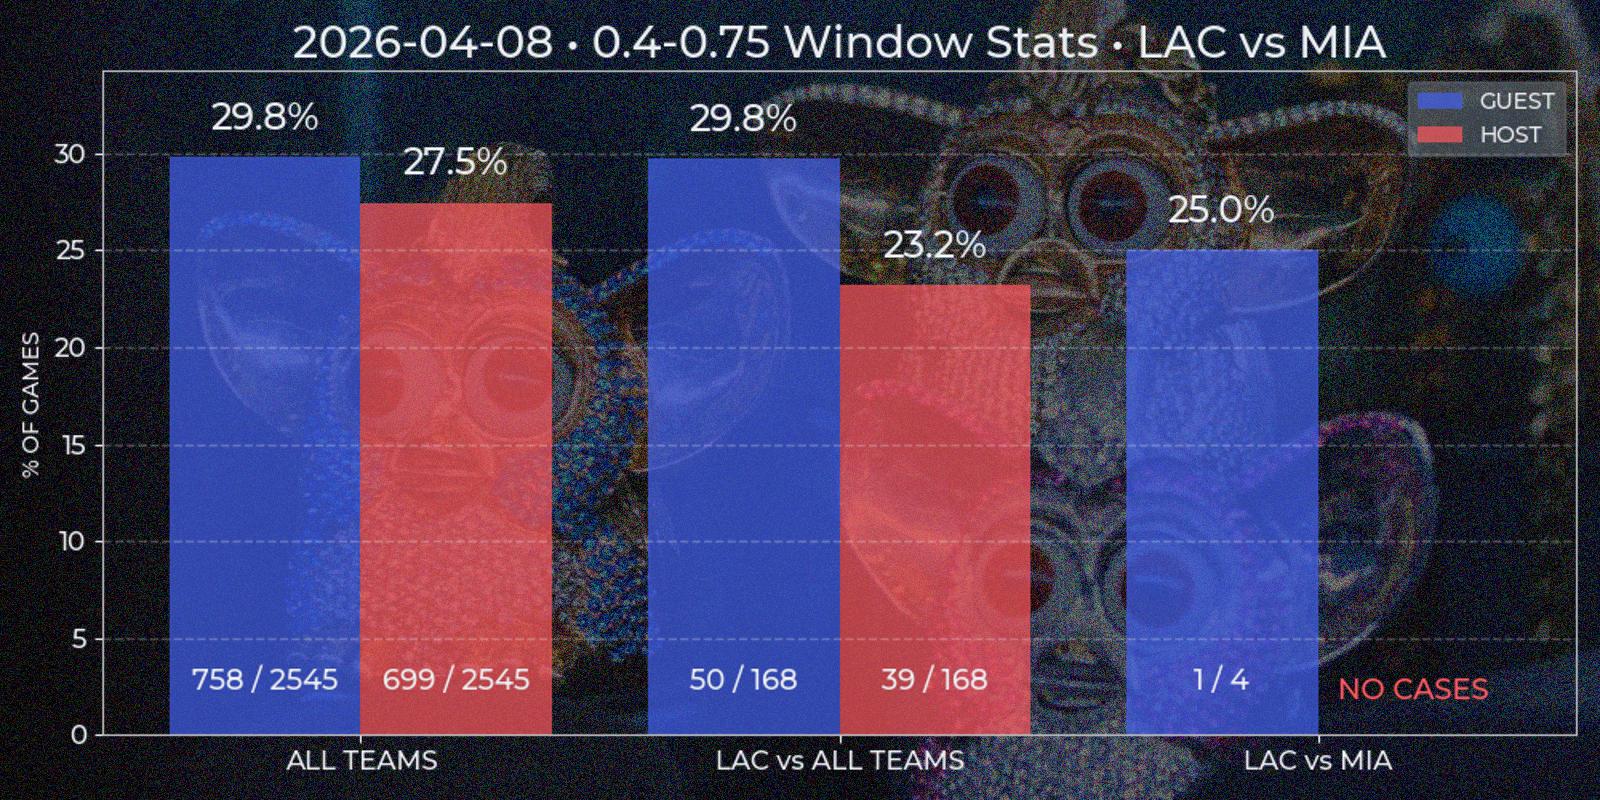
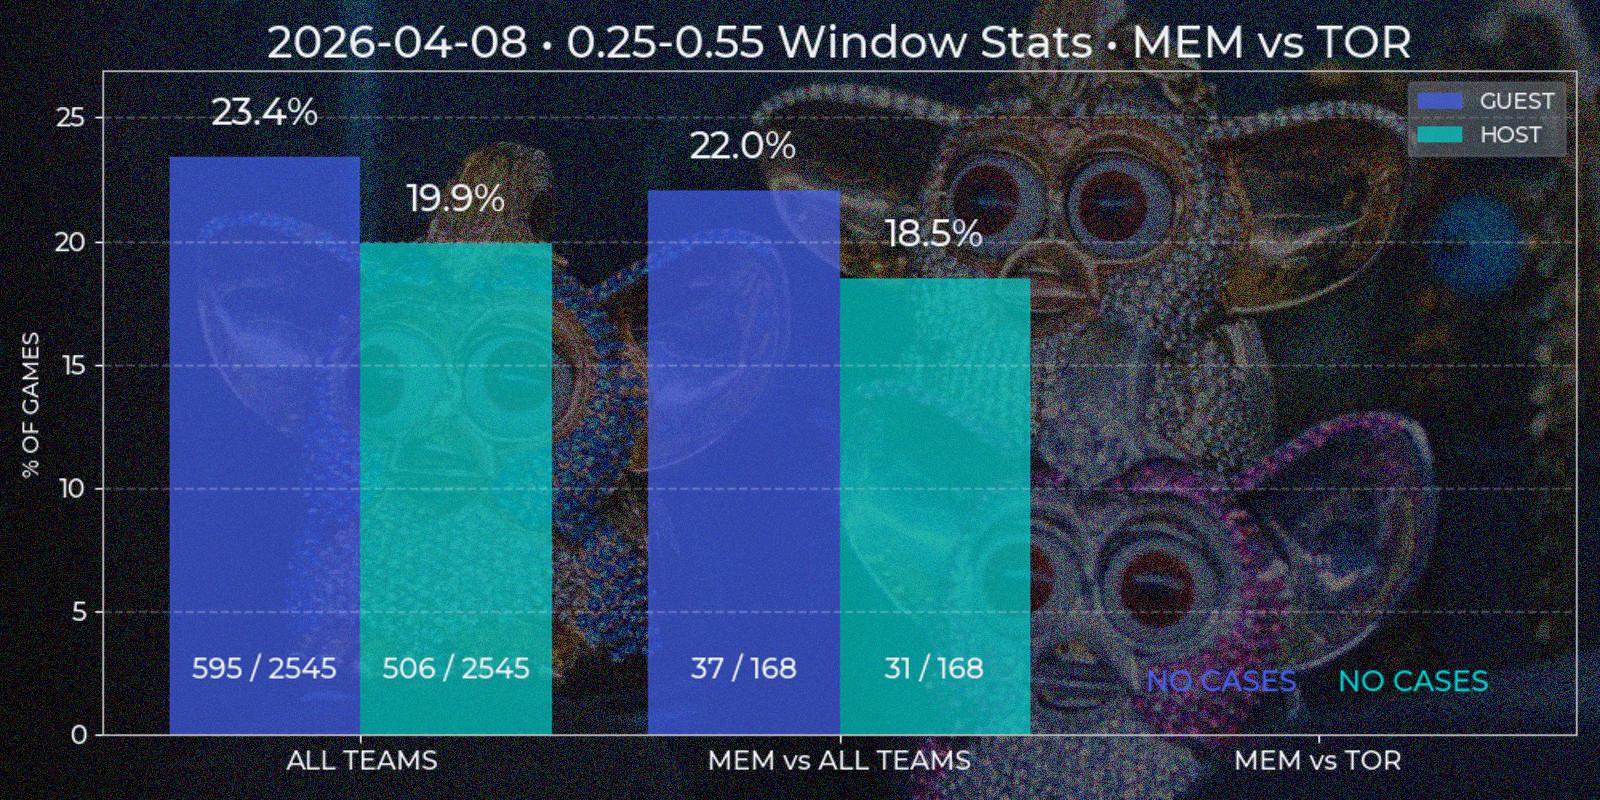
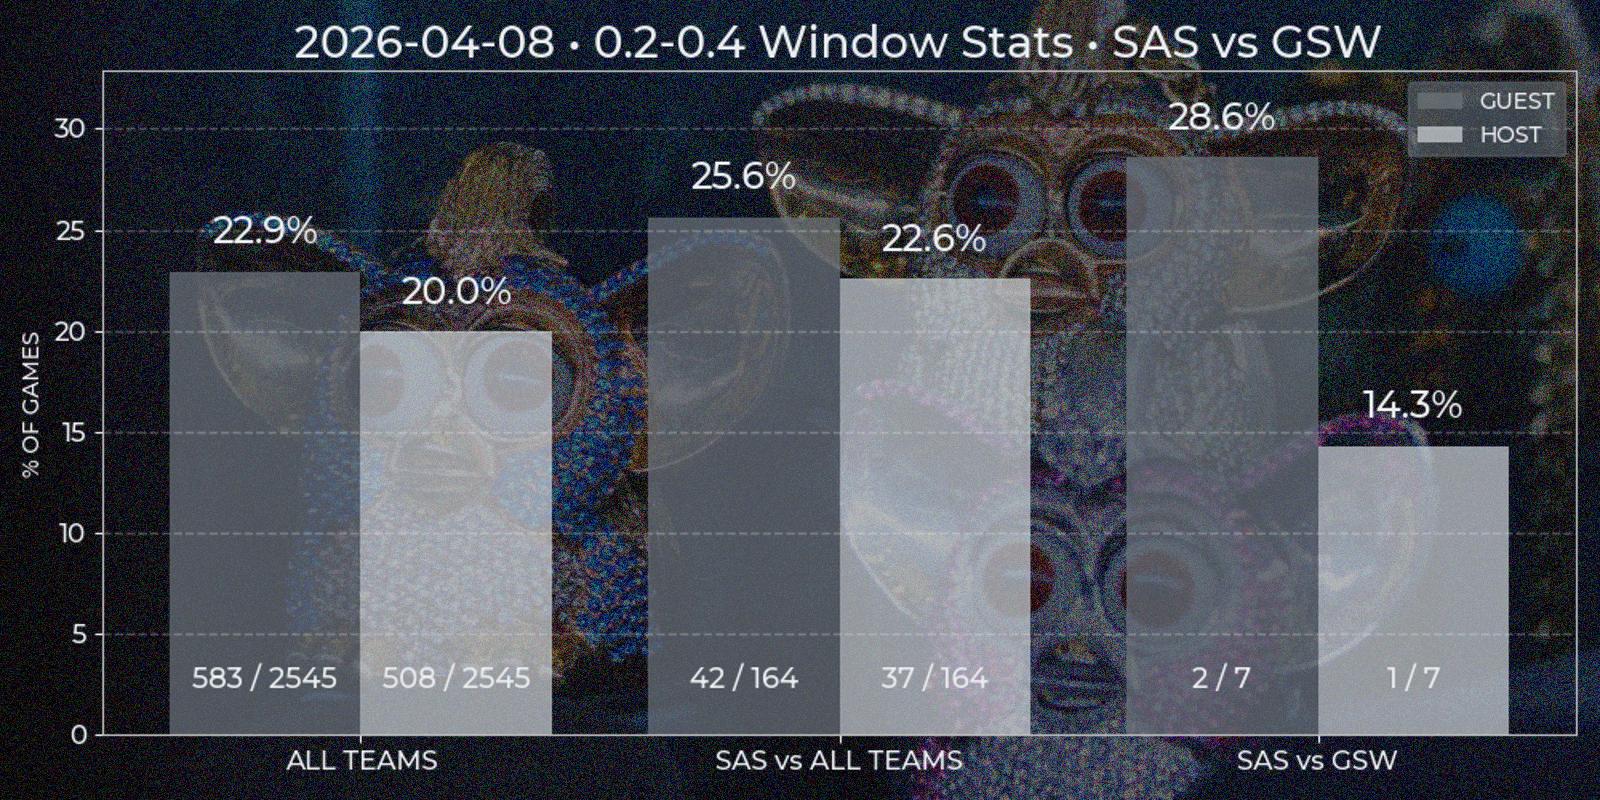
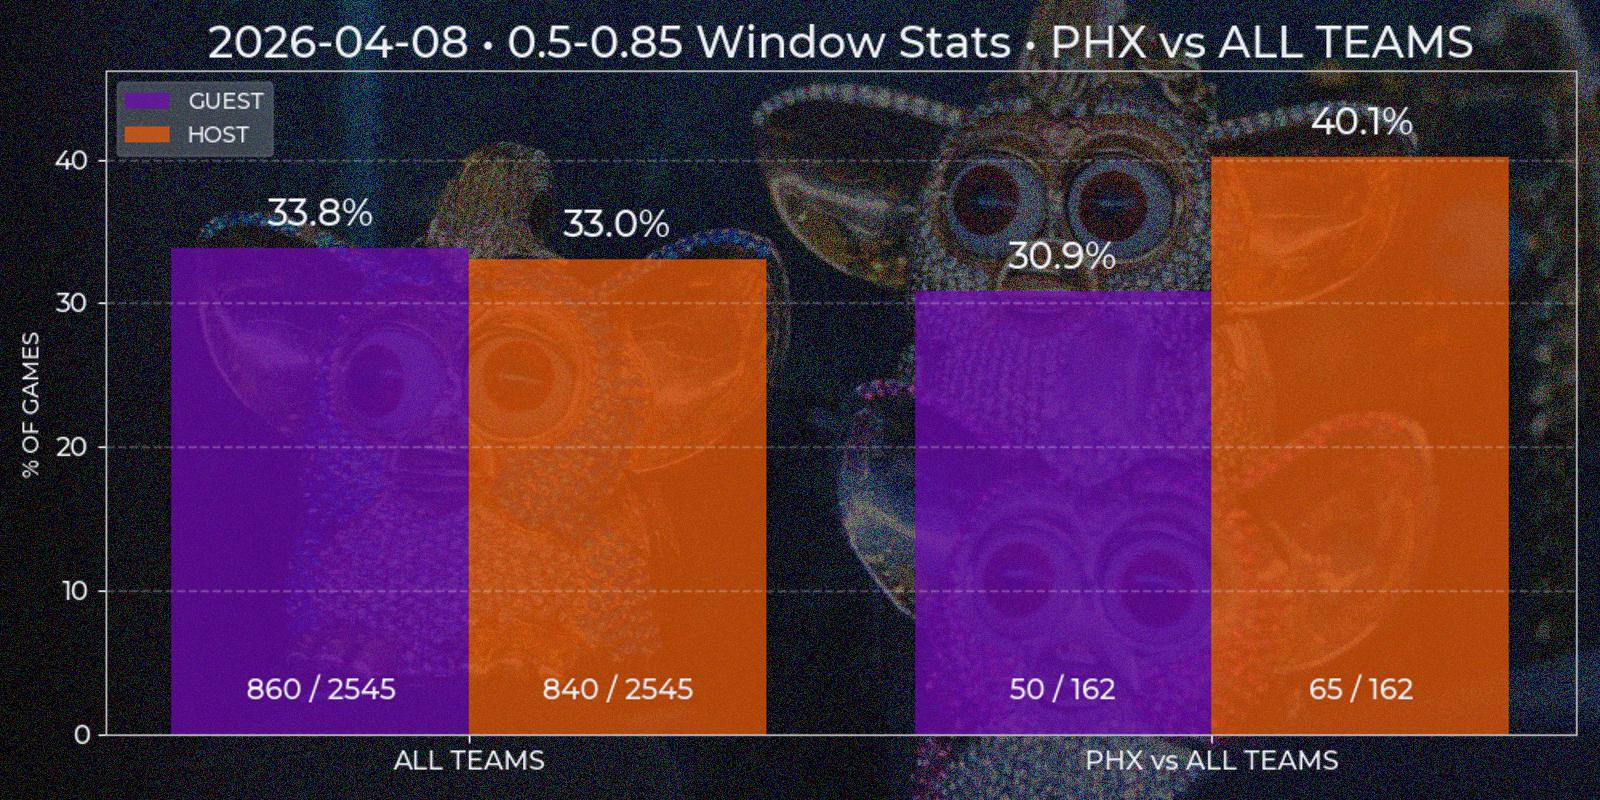
Price Window
Viewing data report of individual games enables further analysis of price behavior, for instance in series of games. For example, how often window from 0.3 to 0.55 happens in all NBA games? What about Los Angeles Clippers? What if they are playing at home agains Utah Jazz? My second appropriately named "Price Window" report should answer such questions. To generate one it is required to input price and date windows. Right now time constraint can be insignificant, since first parsed Polymarket game date is 2024-10-22, which is about year and a half to this post and all game data in database can be considered actual for current games. But for somebody using technical-based analysis in the future the data way over from the past could be more of a irrelevant noise that pollutes the picture.
Price Window report is a bar chart with two mandatory segments – window statistics for "All Teams" across NBA League and for specified "Team A versus All Teams". The third additional bar segment "Team A versus Team B" is added if some Team B chosen as opponent of Team A. All three segments contain two separate bars for "Guest" and "Host" position. At first I considered to implement some type of caching at least for "All Teams" section, since it's value has low dependency of individual game results, but even the relative low of complexity of such task looked like over-engineering. Besides, with time passing this segment is prone to noise injection also, and making more advanced caching logic with this factor in head closed the question.
All data is computed on demand. For each bar SQL query is performed, returning price time series for each game. This data is checked for containing price windows of interest. It is done by a method similar to underdog segments, but simpler because local price minima is not needed. The final ratio is calculated as total games count against found windows count, since there could be multiple appropriate windows in one game. Besides bar height resulting percent is duplicated on the top, with numeric ratio of windows / games is present at the bottom for manual result evaluation (33% has different weight implications in 3/10 and 333/1000 cases).
Optional Services
I am currently developing a Telegram bot to interact with the system. In my previous projects I used python-telegram-bot, but this time I chose aiogram to explore a more modern, async-first framework. I was also drawn to its FastAPI-like design and overall developer experience.
At this stage, the bot remains relatively simple. I have implemented commands for report generation, where query parameters are constructed through a finite state machine dialogue. The bot itself is fully decoupled from the report service logic and operates purely on abstractions such as report names. All visual and textual artifacts are generated on the Report service side. The bot receives only the resulting file paths via a RabbitMQ queue and delivers them to the user. In addition, I implemented a manual database update command and am currently working on commands for retrieving both future and past event schedules directly from the database.
When working on the Trader service, I found Polymarket’s documentation to be quite extensive, with useful explanations, examples, and SDKs for multiple languages – including py-clob-client for Python, which is used for placing limit orders. Tutorials are quite clear, the hardest part might be understanding different Signature Types to use a client:
class BasePolymarketTraderClient(ABC):
    _base = "https://clob.polymarket.com/"
    _chain_id = 137  # Polygon mainnet
    _sig_type = 2    # https://docs.polymarket.com/developers/CLOB/quickstart#signature-types
    _pk: str
    _funder: str

    def __init__(self):
        self.client = self._create_clob_client()
        self.active_limit_orders: dict[str, LimitOrder] = {}

    def _create_clob_client(self) -> ClobClient:
        client = ClobClient(
            host=self._base,
            chain_id=self._chain_id,
            key=self._pk,
            signature_type=self._sig_type,
            funder=self._funder
        )
        client.set_api_creds(client.create_or_derive_api_creds())
        return client
As mentioned at the start of System Overview section, I decided not to open source the Strategy and Trader services. This decision is not about concealing personal trading approaches, but rather about encouraging ownership and responsibility among potential users of the system.
Trading strategies should be developed independently based on individual insight and risk tolerance, and any code that interacts with private keys should be fully understood by the keys owner. Relying on third-party implementations without proper understanding introduces unnecessary risk, and ultimately it is the user’s responsibility to ensure the security of his wallet.
Project Results

So, is it possible to gain a competitive edge by relying only on technical analysis of past Polymarket NBA markets without any fundamental domain knowledge? In this formulation, my answer tends toward "no", at least based on the strategies I explored.
For example, one of the main reasons is that patterns a trader might identify are frequently disrupted by the structure of the NBA season itself, which typically begins in October with the preseason and ends in June with the Finals.
During the 2023–2024 season, the league introduced a new in-season tournament – the NBA Cup. It runs from the start of the season through late November. One of its key features is that playoff qualification depends not only on wins, but also on scored points durning the game. This incentivizes teams to play at full intensity throughout the entire game, undermining assumptions such as teams conserving energy for later periods.
In early February, the trade deadline often reshapes team rosters significantly, which in it's turn affects in-game dynamics and performance. This is followed by the All-Star break, a week-long pause that effectively gives players rest, which can also influence post-break performance.
There is also the well-known strategy of "tanking", where teams intentionally underperform to secure better draft picks or more favorable playoff positioning. In modern NBA seasons, tanking behavior may begin shortly after the All-Star break and continue through the end of the regular season in April. Although the league officially discourages this practice, it is a working strategy and still occurs anyway.
And, of course, during the playoffs, the NBA consistently delivers unexpected outcomes. Favorites lose, underdogs rise, which is exciting for viewers but introduces additional uncertainty for technical trading strategies.
However, if a trader accounts for these factors, follows major news such as injuries and trades, and has at least a basic understanding of teams and players strengths and weaknesses, the horizon becomes more promising. Though I am not deeply loaded in terms of sports statistics, I could not completely exclude fundamental knowledge from my decision-making, even when primarily relying on technical analysis.
After a few months, my profit/loss balance turned positive, and I believe this is because my technical strategy was complemented by fundamental insights. That is why the phrasing of the original question matters: if "without any fundamental domain knowledge" is changed to "with some", then the system may indeed work.
These two quotes sums up all my findings quite well:
"What are often called “persistent patterns” in the stock market occur no more frequently than the runs of luck in the fortunes of any gambler. This is what economists mean when they say that stock prices behave very much like a random walk."
Burton Gordon Malkiel – professor of Economics, financial executive, writer"NBA is always the last two fucking minutes, so let's calm down."
Howard Ratner – degenerate gambler